Data science project on case studies of problems in the Human Resources (HR) Department.

The project management methodology used in this project is CRISP-DM. This methodology is one of several methodologies that are often used in the industrial world. Apart from CRISP-DM, there are several project management methodologies, namely Ad Hoc, Waterfall, Agile Scrum & Kanban.
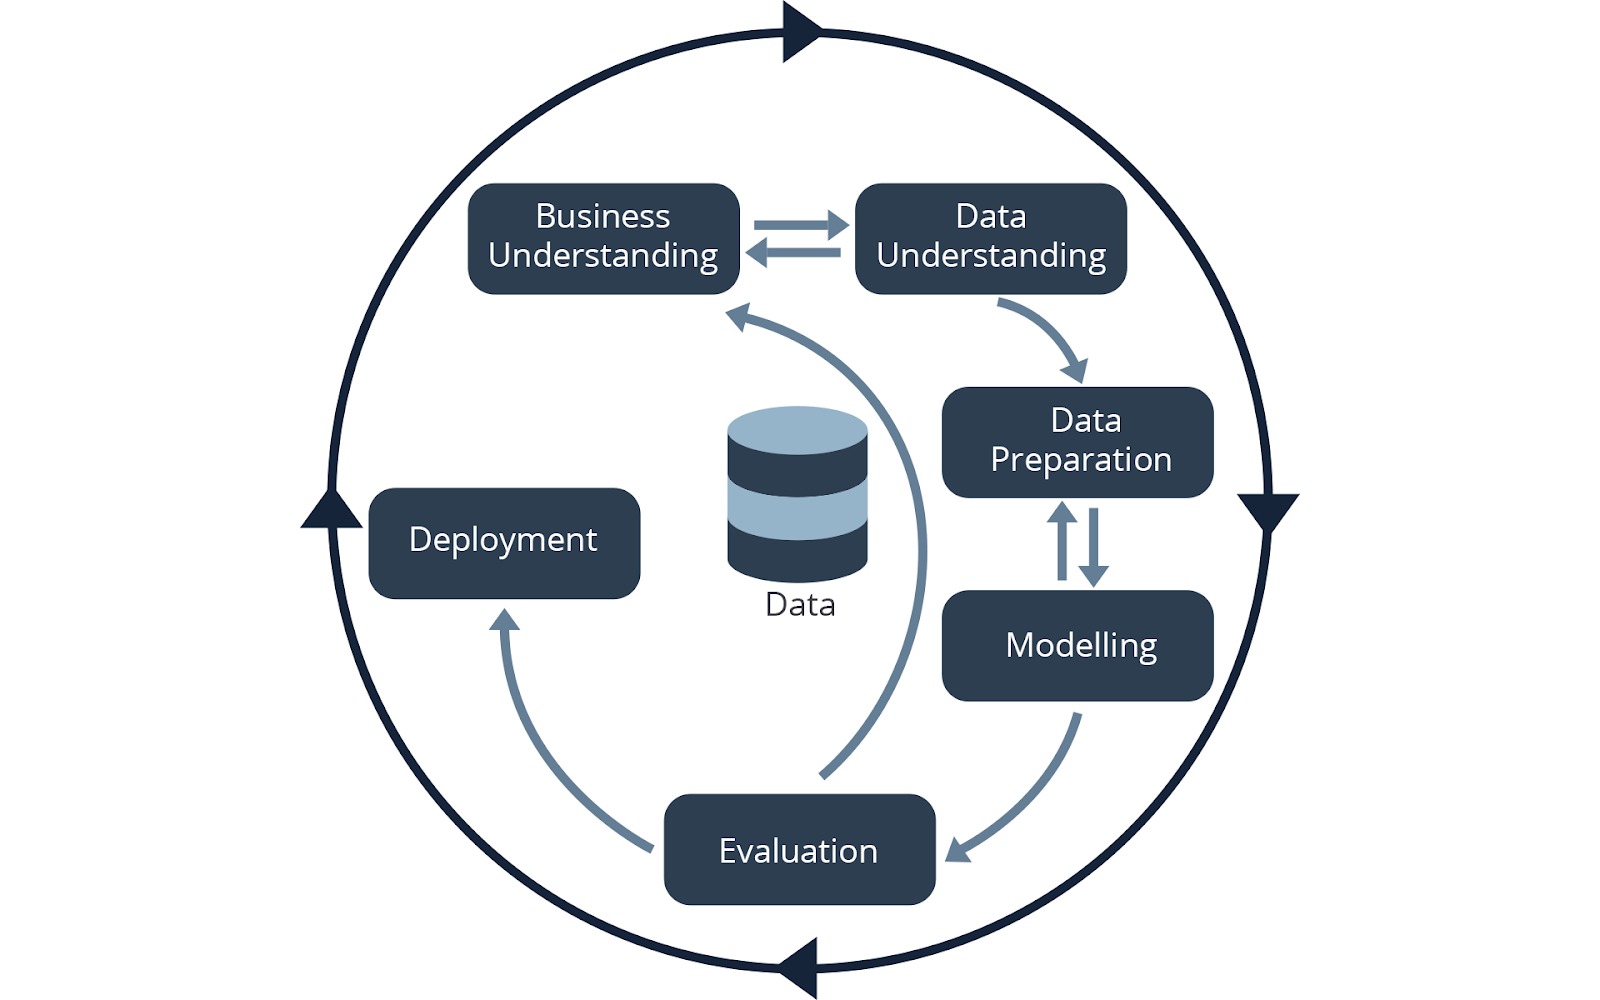
CRISP-DM (Cross Industry Standard Process for Data Mining) is an approach that describes a standard process for data mining, data science, and machine learning projects. In this methodology, work on a project begins with the business understanding stage so that it can help ensure the project is carried out in accordance with business needs. Another advantage of this methodology is that the work process is iterative, so the work process can be adjusted to the experimental needs of the data science project. This is different from the waterfall methodology which only goes in one direction.
CRISP-DM consists of 6 phases and is structured as a cycle, which aims to maximize the outcome of a data science project. The phases of CRISP-DM can be seen in the following picture:
Jaya Jaya Maju is a multinational company that has been established since 2000. It has more than 1000 employees spread across the country. Even though it has become a fairly large company, Jaya Jaya Maju still has quite difficulties in managing employees. This has an impact on the high attrition rate (the ratio of the number of employees leaving to the total number of employees) of more than 10%.
To prevent problems that occur in the company from becoming worse. So it is necessary to identify various factors that can cause employees to leave the company.
Based on the business problems that have been described, to answer these business problems a classification system will be created using Random Forest Classification. So you can identify factors that contribute to high levels of employee attrition.
Apart from that, a business dashboard will be created that can be used by the HR Department to help monitor various factors that cause high attrition rates.
The following are several questions that will be answered in this project by following the SMART-Question concept:
- Specific : What factors influence the level of attrition in a company?
- Measurable : What is the number or percentage of factors that influence the attrition rate?
- Action oriented: What actions can the HR Department take to respond to the factors that cause employees to leave and reduce the attrition rate?
- Relevant : Can this action or action reduce the attrition rate?
- Time bond : How long will the plan to reduce the attrition rate be implemented?
-
Dataset This project uses IBM HR Analytics Employee Attrition & Performance Dataset
-
Tech Stack
- Programming Languages : Python
- AI/ML : Tensorflow, pandas, numpy, scikit-learn, SciPy, matplotlib, seaborn, sqlalchemy, psycopg2-binary, joblib
- Database : PostreSQL
- Devops : Docker image with Metabase
- Other : Git
-
Setup Environment
Library
pip install numpy pandas scipy matplotlib seaborn jupyter sqlalchemy psycopg2-binary scikit-learn==1.2.2 joblib==1.3.1Metabase
username : root@gmail.com
password : root123
The dataset used in this machine learning project is IBM HR Analytics Employee Attrition & Performance. The dataset consists of 1470 records data with 35 features.
| Field | Description |
|---|---|
| EmployeeId | Employee Identifier |
| Attrition | Did the employee attrition? (0=no, 1=yes) |
| Age | Age of the employee |
| BusinessTravel | Travel commitments for the job |
| DailyRate | Daily salary |
| Department | Employee Department |
| DistanceFromHome | Distance from work to home (in km) |
| Education | 1-Below College, 2-College, 3-Bachelor, 4-Master, 5-Doctor |
| EducationField | Field of Education |
| EnvironmentSatisfaction | 1-Low, 2-Medium, 3-High, 4-Very High |
| Gender | Employee's gender |
| HourlyRate | Hourly salary |
| JobInvolvement | 1-Low, 2-Medium, 3-High, 4-Very High |
| JobLevel | Level of job (1 to 5) |
| JobRole | Job Roles |
| JobSatisfaction | 1-Low, 2-Medium, 3-High, 4-Very High |
| MaritalStatus | Marital Status |
| MonthlyIncome | Monthly salary |
| MonthlyRate | Monthly rate |
| NumCompaniesWorked | Number of companies worked at |
| Over18 | Over 18 years of age? |
| OverTime | Overtime? |
| PercentSalaryHike | The percentage increase in salary last year |
| PerformanceRating | 1-Low, 2-Good, 3-Excellent, 4-Outstanding |
| RelationshipSatisfaction | 1-Low, 2-Medium, 3-High, 4-Very High |
| StandardHours | Standard Hours |
| StockOptionLevel | Stock Option Level |
| TotalWorkingYears | Total years worked |
| TrainingTimesLastYear | Number of training attended last year |
| WorkLifeBalance | 1-Low, 2-Good, 3-Excellent, 4-Outstanding |
| YearsAtCompany | Years at Company |
| YearsInCurrentRole | Years in the current role |
| YearsSinceLastPromotion | Years since the last promotion |
| YearsWithCurrManager | Years with the current manager |
This stage includes data gathering, data assessment, data cleaning, or feature engineering processes. In this project several techniques were carried out such as handling missing values, handling duplicated data, and several other techniques.
In this project the machine learning algorithm used is Random Forest.

The random forest algorithm is a supervised learning algorithm that can be used to solve classification and regression problems. Random forest is also an algorithm that is often used because it is quite simple but has great stability.
Random forest is a machine learning model that is included in the ensemble (group) learning category. Ensemble (group) learning is a prediction model that consists of several models and works together. The idea behind ensemble models is a group of models working together to solve a problem. So, the success rate will be higher than the model that works alone. In ensemble models, each model must make predictions independently. Then, the predictions from each of these ensemble models are combined to create a final prediction.
Understanding model evaluation is an important step in the analysis of both structured and unstructured data. Model evaluation helps us know how good our model is at providing the right results. To evaluate a model, we can use several methods or measures that can provide an objective picture of the model's performance. Some measures that are often used are accuracy, precision, recall, specificity, and F1-score. By understanding model evaluation, we can see the advantages and disadvantages of the model we create. So, we can make improvements so that the model can provide better results.
| Metric | Definition |
|---|---|
| Precision | The ratio of true positives to the sum of true and false positives. |
| Recall | The ratio of true positives to the sum of true positives and false negatives. |
| F1 Score | The weighted harmonic mean of precision and recall. The closer to 1.0, the better the model. |
| Support | The number of actual occurrences of the class in the dataset. |
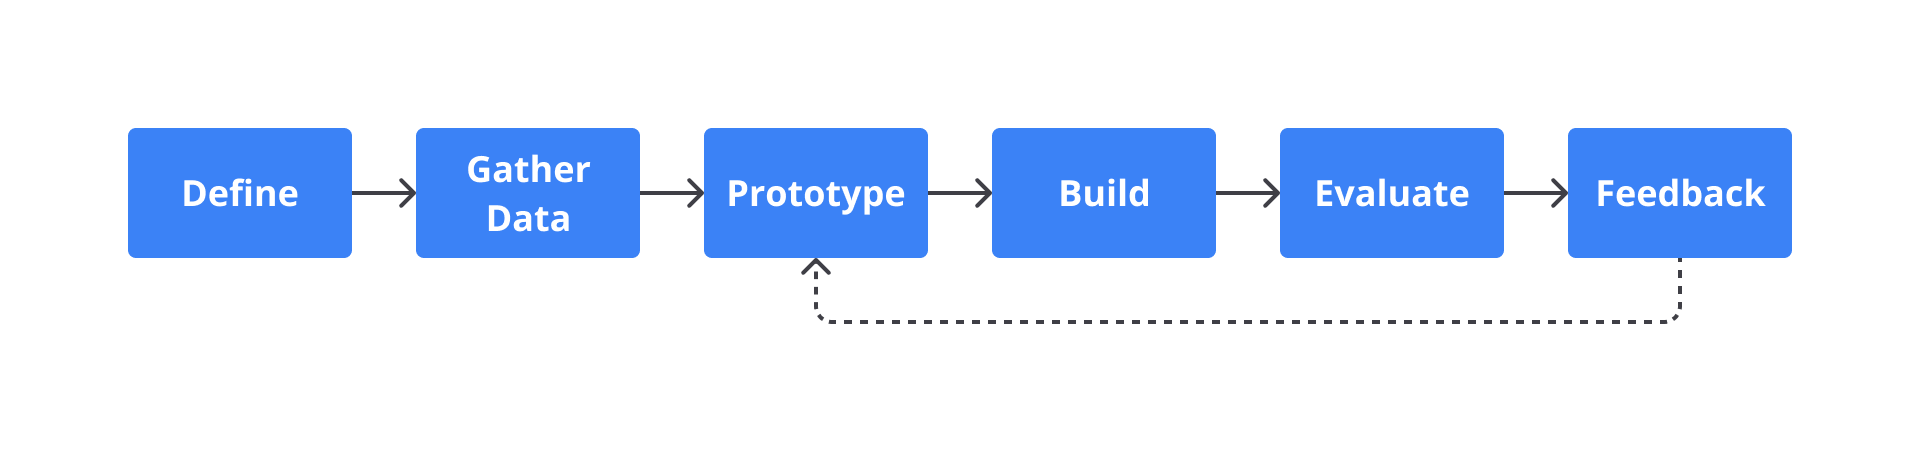
The following are several stages commonly found in developing a business dashboard.
-
Define In the initial stages, of course, we need to understand the audience for the dashboard that will be created. Apart from that, we also need to determine the purpose or output of the dashboard as well as the business questions we want to answer through data visualization.
-
Gather Data The next stage is determining or collecting data that will be used to answer business questions. At this stage, we need to consider the source and quality of the data that will be used.
-
Prototype After knowing the purpose and data that will be used, the next stage is to create a prototype/sketch/mockup of the dashboard that will be created. This will help you create a good and effective dashboard layout. In the process, you need to consider the size of the display and use the right sweet spot.
-
Build If the prototype you have created has been completed, you can start creating and arranging the dashboard according to the prototype you have created. In the process, you need to determine the right graphic form to answer the business question.
-
Evaluation The next stage is to evaluate the dashboard that has been created. This is done to ensure that the graphics and other visual components contained in the dashboard are effective and easy to understand.
-
Feedback Lastly, we also need to ask for feedback from the audience or users regarding the dashboard that has been created. This will certainly really help us in creating a better business dashboard in the future.
The business dashboard that has been created can be accessed at the following link:
SMART (Specific - Measurable - Action oriented - Relevant - Time bond)
Based on the KPI & insights obtained from the analysis results, it can be concluded that there are several factors that influence the attrition rate of the Jaya Jaya Maju company. These factors are monthly income, overtime, age, total working years, and distance from home (Specific).
From the previously created business dashboard, several insights can be obtained, some of which are as follows:
-
As many as 85% (153 employees) who stopped working earned a low-medium monthly income. Meanwhile, employees with higher monthly income (high income) tend to stay or work at the company. (Measurable) By considering the impact of wages on the company's attrition rate, reconsideration or efforts are needed to review and collect information to find out whether the company provides competitive wages according to market conditions. So that employees feel appreciated and encouraged to continue working. (Action oriented & Relevant)
-
Employees or workers in the 18-40 year age group have a greater tendency to stop working than those in the older age group. (Measurable) Therefore, efforts that can be made are aligning the long-term vision with young employees, as well as providing intensive, career, as well as clear promotions. (Action oriented & Relevant)
-
The distance between the office and residence also influences the attrition rate of the Jaya Jaya Maju company, based on analysis results, 59% (107 employees) who left or stopped working lived very far from the office. (Measurable) Related With this problem, companies can provide transportation support for employees or provide support in the form of transportation allowances. So it can reduce the company's attrition rate. (Action oriented & Relevant).
-
As many as 54% (98 employees) stopped working due to overtime. (Measurable) Therefore, efforts that companies can make are planning or scoping projects that are carried out properly at the beginning and with adequate workforce, so that employees workers do not work overtime. Another alternative is giving compensation to employees who have worked overtime, so that it can reduce the attrition rate. (Action oriented & Relevant)
-
As many as 65% (117 employees) who stopped working were related to business travel factors at a rare level. This shows that business travel has an effect on the attrition rate. Steps that companies can take are to review and optimize business travel policies for all employees in order to minimize employee stress levels and help retain employees. (Action oriented & Relevant)
The results of the analysis or insight obtained along with the steps the company can take to reduce the attrition rate must be carried out within a clear time period. To begin with, certain programs that have been designed will be implemented during the first six months. Then an evaluation of the program is carried out to find out whether there are significant changes to the attrition rate of the Jaya Jaya Maju company. (Time Bond)
On the other hand, steps are also needed such as holding regular face-to-face meetings within a certain period of time between HR managers and employees who are at high risk of leaving or quitting their jobs. With the aim of knowing and discussing the working conditions experienced. So that stakeholders can determine appropriate preventive measures and solutions.
If you have any feedback, please reach out at syarifulm007@gmail.com