Debugging in VS Code
FlowEmu comes with a configuration for Visual Studio Code (VS Code) to debug FlowEmu in a Docker environment. The configuration is loaded automatically when opening the FlowEmu repository as a workspace in VS Code.
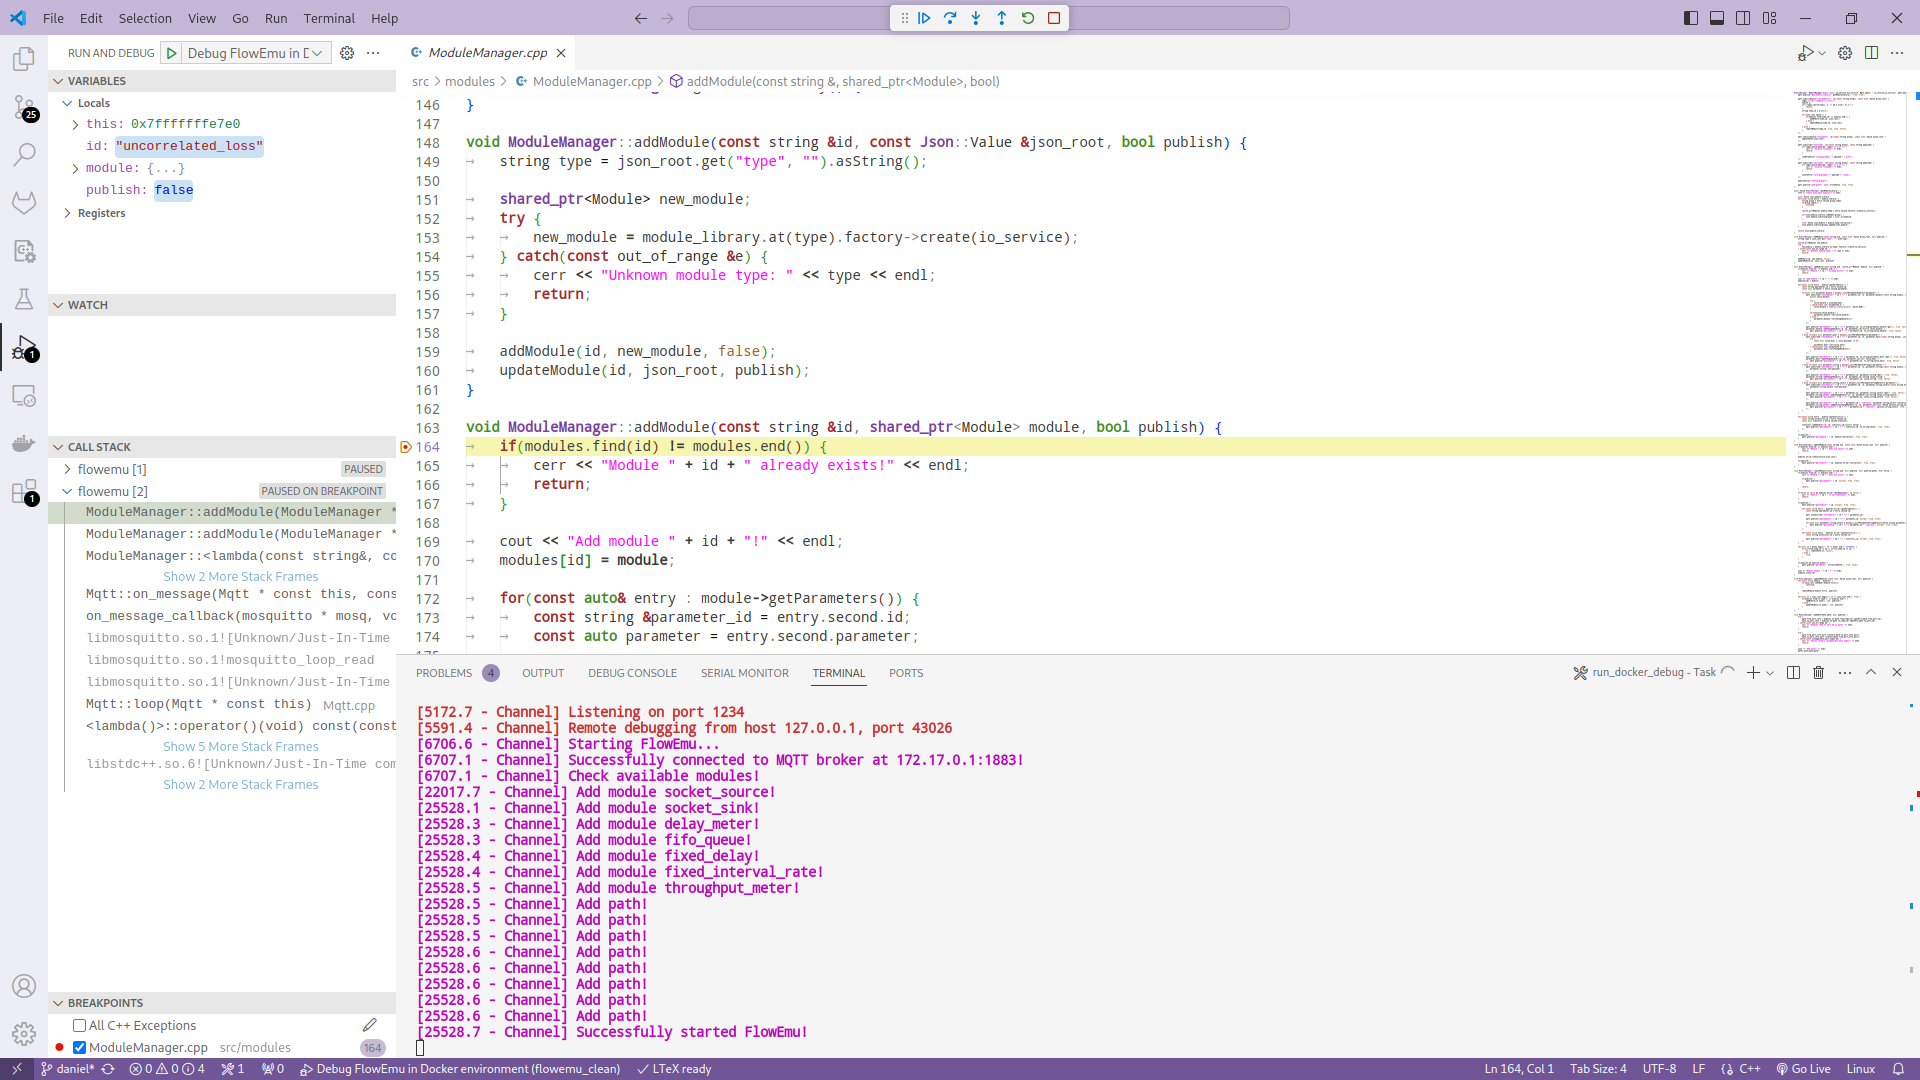
To start debugging, click on the Run and Debug activity on the left-hand side of the VC Code window. Then select the Debug FlowEmu in Docker environment launch configuration and press the green play button. FlowEmu should now ask for the sudo password in the terminal window on the bottom. A screenshot of VS Code during debugging of FlowEmu can be seen below.
Debugging of FlowEmu in a Docker environment works as follows.
A Docker image with a debug build of FlowEmu is created using the Dockerfile_debug.
This version is then executed in the special docker_debug environment, which starts FlowEmu together with a GNU Debugger (GDB) server.
The included debug configuration makes VS Code connect to the GDB server inside the Docker container.
From there on, all debugging features of VS Code can be used as usual. Breakpoints can be set in the source code by clicking left to the line number. The execution of FlowEmu can be paused and stepped using the floating control panel. While the execution is paused, the call stack and variables are shown in the sidebar of the Run and Debug activity.