Humans can easily tell by looking at a chart whether a trend is up or down. A computer cannot. So, one needs a way to put in an input and get a consistent output back out.
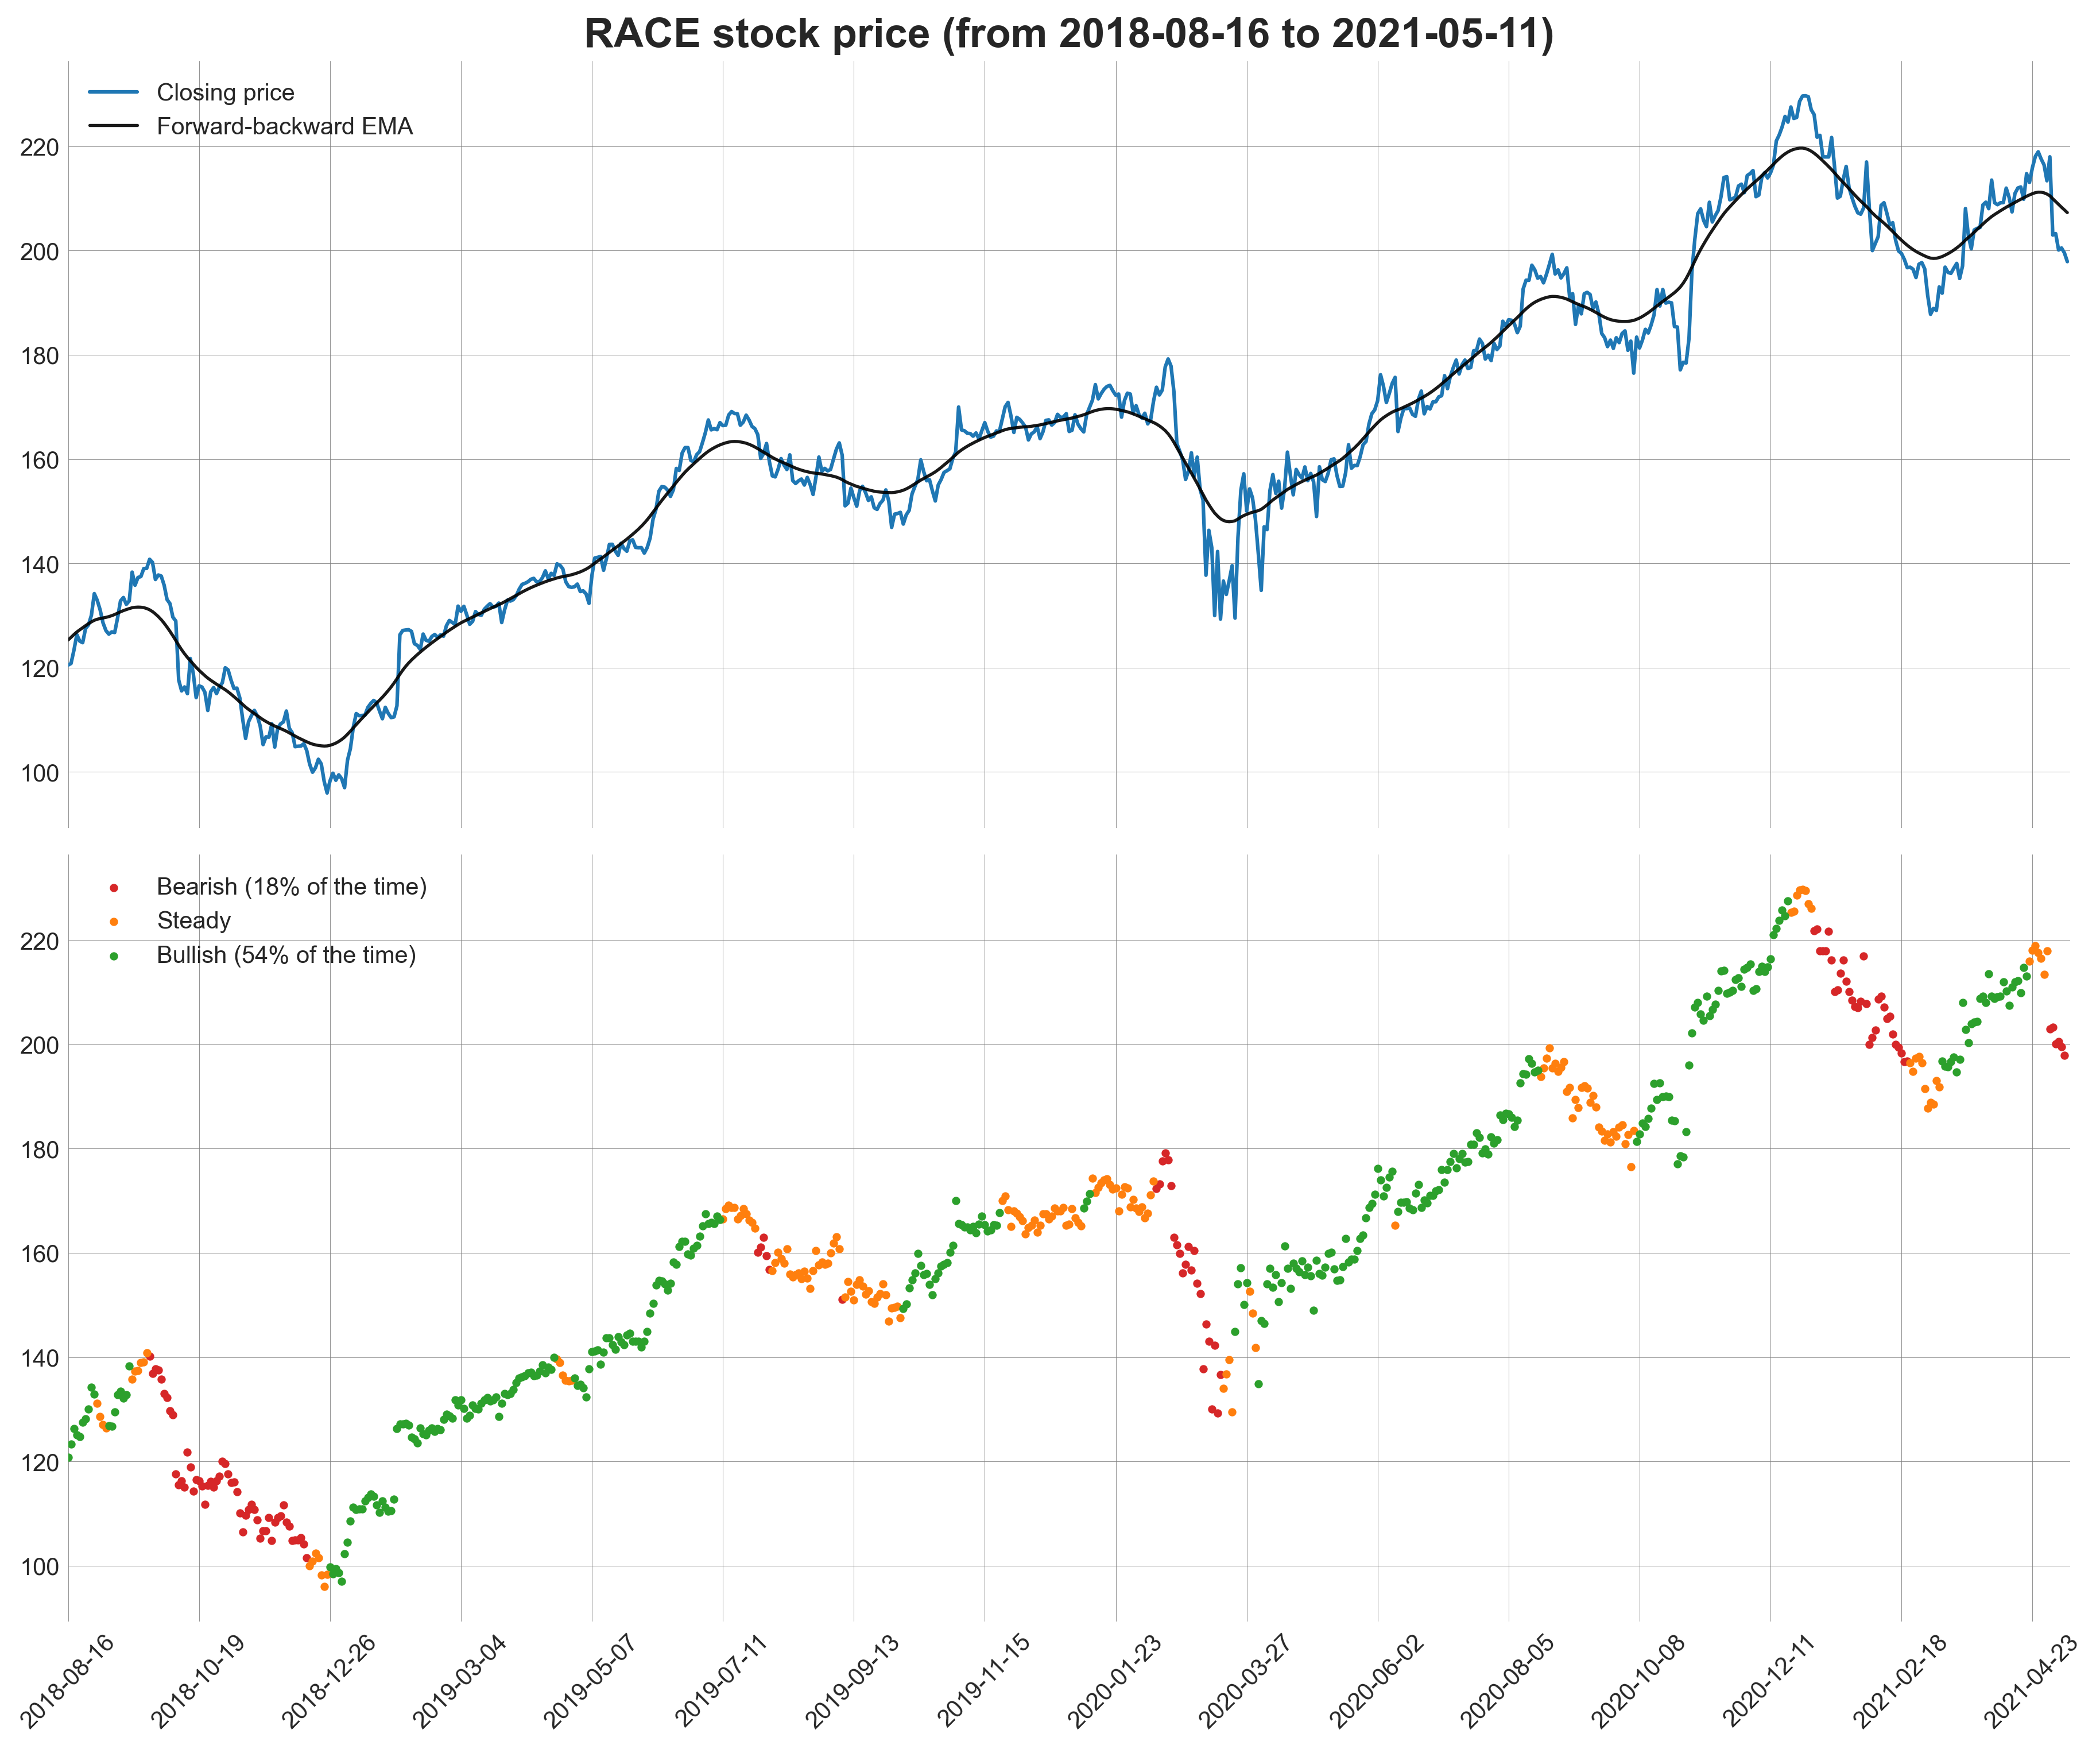
In this project, I analysed the time series of stock prices. Using a forward-backward filter, I smoothed the data, and then used a k-means clustering algorithm to break it down into three trends: bullish, bearish and steady. The analysis is summarised in the IPython notebook, while all the relevant function are defined in the helper_func.py module.
As an example, this is the time series for RACE, the Ferrari stock.
